
WALTER ALSTON'S SCHOOL FOR BOYS

Each day or night, as the Dodgers added victory after victory to their fast-breaking getaway, until they had achieved a modern major league record of 10, one man in the Brooklyn dugout—a pitcher—remained detached from the usual chatter; divorced from the unpire-baiting and the biting inter-bench jockeying. It wasn't always the same man, but he was always busy on the same job. He was keeping a chart, on a large, yellow piece of paper. The paper, strangely checkered, was attached to a conventional clipboard (below) the man kept in his lap.
One day he was Carl Erskine; the next, Russ Meyer; then maybe Billy Loes, or Clem Labine; or Carl Erskine again. Whoever he was, this was not his day to pitch. This was his day to watch intently every pitch made by his teammate and to record it on the chart. Fast ball...curve...change-up...slider...screwball. High, low, inside, outside, foul. And at the end of the 10 games, there, on the clipboard hanging in the office of Dodger Manager Walter Alston, was a record of every pitch thrown by a Brooklyn pitcher during that opening rush.
TEACHER'S TIPSHEET
The streak ended on the 11th game, but the charts go on, win or lose. Later they are consulted, analyzed, discussed. They show:
How many fast balls Don Newcombe threw this day—or maybe it was Johnny Podres. How many he got over for strikes, how many missed for balls. How many curves were high, how many low. Which pitches were hit by Sid Gordon—or was it Willie Mays? And where were they hit—to left, right, center; on the ground, in the air?
What purpose does all this serve?
Says Alston, a former schoolteacher who has not lost his faith in instruction: "It will show me when a pitcher's curve is hanging too often, or when he's not getting his change over. And it'll help me show it to him, because he won't be taking my word for it; it'll all be there, in black and white, and I won't have written it down."
That's one reason Alston has the charts kept by non-working pitchers. But there's another reason, regarded by Alston as more important: "It keeps pitchers on the bench in the game every minute."
Fans who watched Rex Barney for years take sun baths on the edge of the dugout, head tilted upward for maximum benefit from the rays, and eyes closed for minimum benefit from the game, those fans know what Alston means by "keeping in the game." Other clubs have charted pitches, but the job was usually done by an assistant in the stands or press box. Alston has brought it down into the dugout, so that his men have to study the work of other pitchers.
Quite often the pitcher making the marks on the chart may be flanked by spotters who assist him in calling each pitch. Thus two, or even three non-playing pitchers, are "in the game."
And how are the pupils taking to Teacher Alston's new project? "Some of them are more interested in it than others," confesses the teacher. He smiles and adds: "The day we set the record, Billy Loes started the chart (right). He gave it up after a while and Erskine finished it."
As might be expected, Erskine, the star of the staff, also is the star pupil. He keeps the neatest charts, manifests the greatest interest.
"I was hoping Alston would let me keep them all," says Erskine. "You'd be surprised how many things you see that you never noticed before."
He gave examples:
"I kept the chart on Newcombe against the Giants in that first series. Newk threw eight changeups that day, and got them all over. Two were high, but they were hit—for basehits. A high change is the same as a high curve, it's a weak pitch."
Another thing:
"A chart like this will show you if a pitcher is falling into a set pattern. He might be throwing a fast ball and following with a curve, or two fast balls, then a curve. If he does that repeatedly, it's a pattern that the other team will look for."
And another:
"Later in the season these charts might help us rig our defenses. We usually shade Whitey Lockman to left field, but the chart the other day showed that he pulled Loes. Maybe we can play him different next time."
Alston admits the chart is far from perfect. For example, the present markings don't differentiate between a called strike and a swinging strike. However, it's still new enough to be altered. "I think we can come up with better symbols," he says, for one thing.
On the evening the unbeaten Dodgers were to play the Giants at Ebbets Field, Alston agreed to turn over to SI the chart on game No. 10, which had established the record, and No. 11, which was to start in a few minutes. Three hours later, the Dodgers no longer were unbeaten. Teacher Alston produced the chart on game No. 10. He declined to hand over game No. 11, explaining that he had spotted something and wanted to go over the chart with Pitcher Podres, who had lost the game and was being kept after school.
PHOTO
CHART
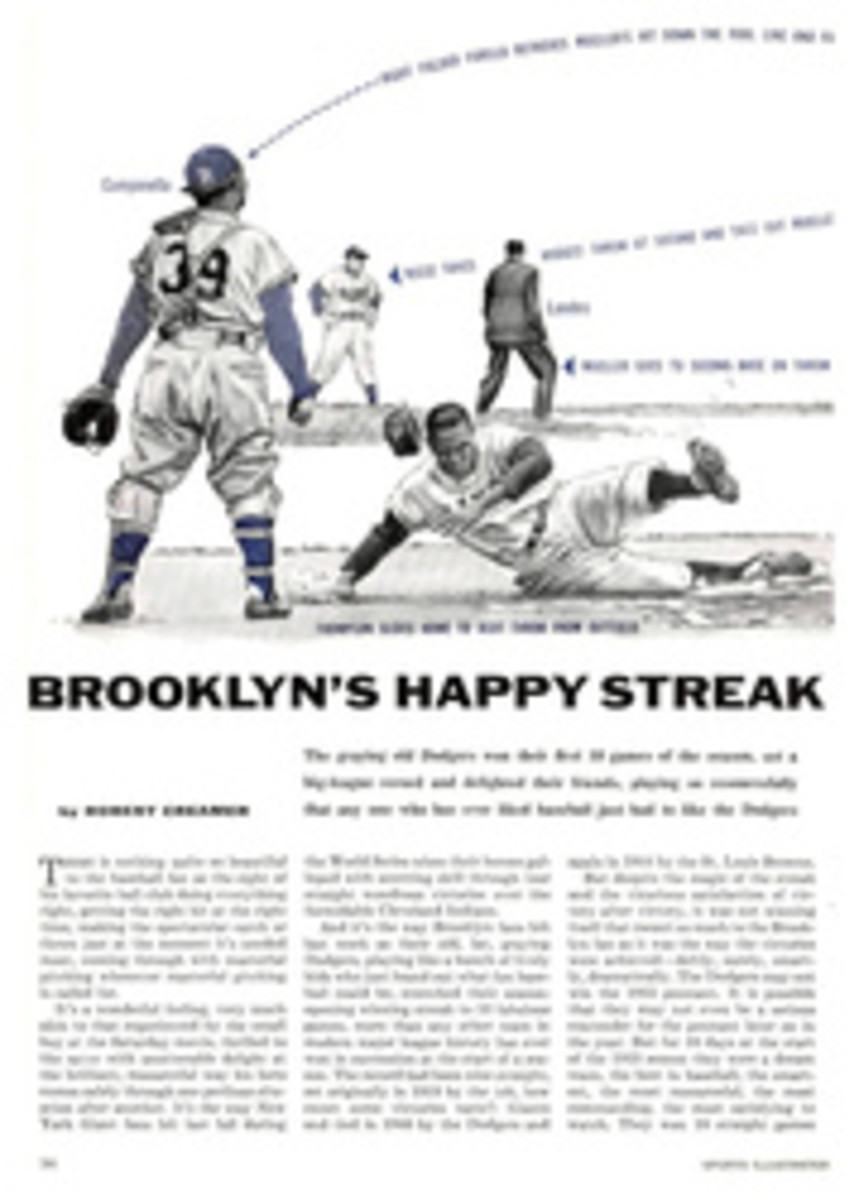
DOPESHEET ON DODGER PITCHING
Pitching chart kept by Billy Loes and Carl Erskine shows what happened with every pitch thrown by the Dodgers during record-breaking 10th straight victory. Tiny boxes in line with Philadelphia players' names show balls (B), strikes (S); dot under strike means foul. Position of symbol indicates whether ball was high, low, inside, outside. Large boxes represent playing field with home plate at lower left. According to the chart, Russ Meyer's opening pitch, a low slider, went past Bobby Morgan of Phillies for a strike, then Morgan hit second pitch, low fast ball, into left field stands for home run. Darkened line around infield shows Morgan scored. Next man up to bat, Earl Torgeson, saw a fast ball go over for strike, then grounded waist-high curve to first baseman (3) who made play unassisted (u). Chart-keeper's conclusion from the first two batters: Morgan will wait long time for next low fast ball from Meyer.