
HITTERS CAN BE RANKED

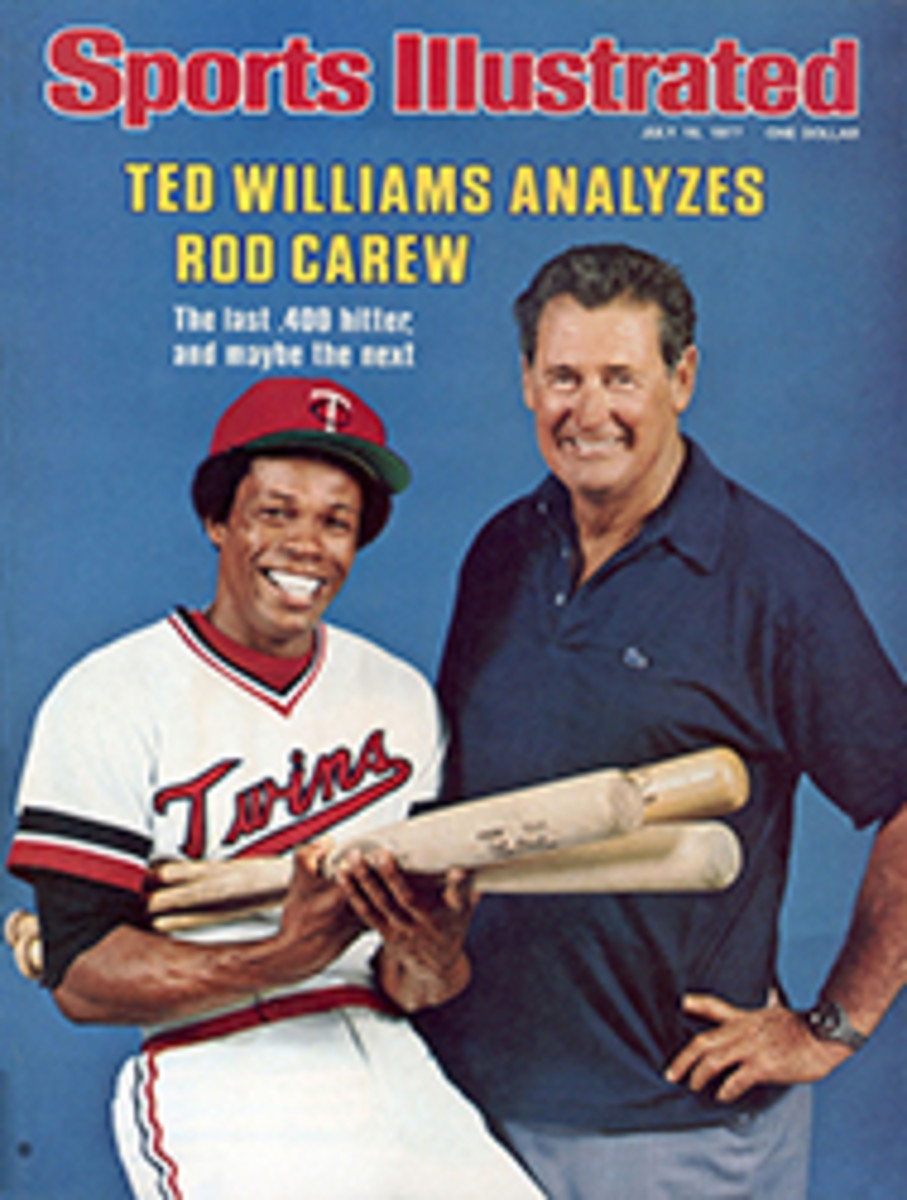
Because of baseball's wealth of statistics, its fans are able to argue interminably about the relative merits of its greatest players. Walter Johnson vs. Bobby Feller vs. Sandy Koufax can fill up an evening. Ultimately, when considering players from different eras, most fans conclude that there is no way to prove who was best. But, at least for hitting—that is, for batting average—there is a way to make such a determination. There are figures to show that Ty Cobb is best, that Shoeless Joe Jackson is second best, that Rod Carew is third and Ted Williams fourth.
Cobb's lifetime average of .367 is, of course, the highest career average in the history of the game. But that is not what accounts for his superiority. I wanted to develop a "true" figure that would take into account relative hitting prowess—a system that could compare Cobb in the teens with Carew in the '70s. I think I have done that.
It is important to understand first that baseball is not just made up of eras. There have been sharp fluctuations in its batting statistics even from one year to another. The American League, which is hitting .266 this year, bottomed out at .230 as recently as 1968; it had peaked at .292 in 1921 and again in 1925. The National League high of .309 came in 1894, just six seasons after its low of .239.
There are often obvious reasons to account for these shifts. For example, the distance from the plate to the mound was not lengthened to 60'6" until 1893. Until 1887 a batter could ask the pitcher to throw to his favorite spot. The sacrifice fly rule has been altered as frequently as women's hemlines; in some years such outs were counted as official at bats, in others not. There have also been a number of changes in the strike zone—most recently in 1950 (from the top of the batter's armpits to the tops of his knees); in 1963 (from shoulder tops to knee bottoms); and in 1969 (armpits to knee tops). Other variables also come into play: balls get livelier or deader, pitching mounds are raised or lowered, expansion teams are added, gloves more and more resemble Venus's-flytraps.
Nonetheless, couldn't a system be developed that would tell us how good a hitter was no matter when he played?
As an example, let's examine the career records of Williams and Carew. Williams' lifetime average was .3436, Carew's is .3322. (These figures must be carried to four places or the True Batting Averages may be thrown off by a point or more.) During the years Williams played, the American League batting average was .2611, so he exceeded that figure by .0825. During Carew's career, the American League average has been .2491, and he has exceeded it by .0831. Although both have surpassed the league average by an almost identical margin, Carew's increase is more significant because in his career the American League average has been .0120 lower than it was in Williams' time. Therefore Carew's percentage of increase is higher.
One must next translate these individual increases over the league batting average into a more meaningful number—an improvement percentage, or what I call IMP. This is done by dividing the player's added percentage points by the league average in the years he played. Thus, Williams' IMP is 31.60% (.0825 divided by .2611), and Carew's is 33.36% (.0831 by .2491).
IMPs are significant in themselves, but they are best employed to obtain a True Batting Average. To reach that figure, two more steps are required. First, a player's IMP must be multiplied by the all-time major league batting average, so he can be compared to everyone who ever played. After 101½ seasons, the National League mark is .2631, while the American League's is .2616 after 76 seasons. The combined average for all major leagues (NL, AL, the American and Union Associations and the Players' and Federal Leagues) is .2618. So, by multiplying a player's IMP by the alltime major league average—.2618—it is possible to calculate the number of percentage points by which he exceeded it. Williams bettered the average by .0827, Carew by .0873.
The final step in arriving at a True Batting Average is to add these extra percentage points to the alltime mark of .2618. Williams' TBA comes out to .3445, Carew's to .3491.
Using the TBA system, a chart of the top 20 batters who played more than half their careers since 1900 has been compiled. The TBAs of all players with 1,500 or more hits have been computed and the procedures and figures have been corroborated by Seymour Siwoff's Elias Sports Bureau, the statisticians used by both major leagues. The figures for Carew and Pete Rose, the only active players, have been updated through last Sunday, July 10.
Although it was necessary to do so in only a few instances, seasons in which batters had fewer than 100 at bats were deleted from their records. The reason for this is exemplified by the case of Shoeless Joe Jackson, who in four seasons (1908-10 and 1918) had a total of 180 trips to the plate and hit .333. The league averages for those years were so low (.245) that they would have unfairly raised his TBA to .3653, above Cobb's.
If the chart were to include those who played in the earliest days of the National League, seven old-timers would be included. These seven, with their TBAs, are: Pete Browning (.3518), Dan Brouthers (.3398), Ed Delahanty (.3317), Cap Anson (.3312), Billy Hamilton (.3307), Jesse Burkett (.3287)' and Sam Thompson (.3263).
The virtue of the TBA system is that it harbors no manipulated numbers, for it is based on "pure" mathematics. If there is any question to be raised about the chart, it would be that Carew has not suffered through those end-of-the-career seasons when batting averages usually tail off. (And, to be fair to Williams, his TBA would probably be much higher if he had not lost five prime years in military service.) On the other hand, it is possible that Carew, 31, might not yet have reached his peak and that his TBA will rise in subsequent years. Many of the finest hitters were at their best during their 20s, but many others had exceptional seasons in their 30s. Only five players have won more batting titles than Carew, who has five. Cobb won nine of his record 12 in consecutive years (1907-15) by the time he was 28. But Honus Wagner (eight titles) won four in successive seasons between the ages of 32 and 35. Two years later, at 37, he won his last title. Rogers Hornsby (seven) was a winner at 32, Stan Musial (seven) at 31 and 36, Williams (six) at 39 and 40, while Cobb's final championship came at the age of 32.
Carew's TBA might also be marginally lower than it should be because designated hitters have been used in the American League for the past five seasons. DHs have hit .2563 since they were introduced, well above what pitchers would have batted. Thus, the Designated Hitters' average has boosted the league mark a few points during Carew's career and, accordingly, cut down on his IMP and his True Batting Average. Still, his third-place ranking, well behind Jackson and well ahead of Williams, would not be affected.
[originallink:10592576:43697]
PHOTO
Cobb is still tops in both BA and TBA.