
Picky, Picky, Picky! As the oh-so-choosy Yankees proved last season, working the count can drive pitchers batty, produce runs and win games--no matter how long it takes
Chuck Knoblauch's leadoff at bat against Andy Ashby in Game 2 of
last year's World Series didn't make very many highlight videos.
But if there was a defining moment in the New York Yankees'
sweep of the San Diego Padres, it may have been this extended
plate appearance. After quickly falling behind in the count 0
and 2, Knoblauch, the Yankees second baseman, curled in his
stance like a question mark and girded for protracted battle. He
adjusted his helmet, fixed his gaze on the pitcher and didn't so
much as flinch when Ashby's next offering barely missed low and
away.
Sensing the challenge, the Padres righthander adjusted his
rhythm and took an extra few seconds before his next pitch, a
heater down the middle that Knoblauch fouled off. Ball two--a
thigh-high slider a bit outside--followed. Then the pesky batter
fouled off another pitch. After Knoblauch fiddled in the box,
Ashby missed the plate with his next two pitches, with ball four
almost hitting Knoblauch.
Having thrown eight strenuous pitches in the most high-stakes
game of his life, all Ashby had to show for his labors was a
base runner. Knoblauch would steal second and, later in the
inning, score on a throwing error by Padres third baseman Ken
Caminiti. It was the first of three Yankees runs in the first.
Next inning, centerfielder Bernie Williams jacked a two-run
homer on the ninth pitch of his at bat, giving New York a 6-0
lead. After 66 pitches, Ashby was ashes, having lasted just 2
2/3 innings, the briefest outing of any San Diego starter all
season. "The Yankees were so disciplined," recalls Dave Stewart,
the Padres' pitching coach at the time and now the assistant
general manager of the Toronto Blue Jays, "that the game was
tough to watch."
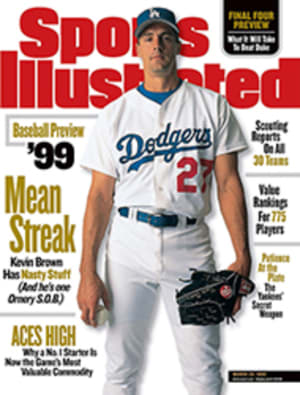
Not that Game 1 had been any easier. San Diego's ace,
righthander Kevin Brown, took a 5-2 lead into the top of the
seventh, but, having been induced to throw 108 pitches, Brown
was pulled with one out after catcher Jorge Posada, the number 8
hitter, singled, and leftfielder Ricky Ledee walked on four
pitches. With Brown in absentia, New York pounded two relievers
for seven runs (the first two charged to Brown) and won 9-6.
"I've never seen a team so good at working the count," declared
Padres general manager Kevin Towers afterward. "They weren't
swinging at pitches that the Astros and the Braves were going
after," Towers added, alluding to the teams San Diego had
vanquished in the postseason.
Never mind the Yankees' reputation as the Bronx Bombers: In the
late '90s they have fielded teams for which AB might as well
stand for "abstaining." Far and away the most selective
collective in baseball, New York hitters saw an average of 17.5
pitches per inning from opposing starters last season. It's not
so much that the Yankees intentionally take pitches; they simply
refuse to put the disagreeable ones into play. "We realize that
to beat a team's best starters, you have to hit as a unit," says
first baseman Tino Martinez. "Each guy has to be disciplined and
try to wear the pitcher down."
More to the point, the Yankees recognize that the best strategy
for beating an opposing ace rests on a tactic overmatched boxers
might use in the ring. They methodically work the body, blunt
the behemoth's power and exhaust him by the middle rounds. The
more a pitcher throws, the sooner his pitch count hits critical
mass, and the better the chance he gets yanked for a middle--and
often middling--reliever.
Just how heavily do the Yankees emphasize these jabs to a
pitcher's solar plexus? Manager Joe Torre professes ambivalence
when Knoblauch practices his subspecialty of hitting first-pitch
home runs (six in the past five years). "It's one of those
Catch-22 situations," says Torre. "You're glad to have the home
run, but we need our leadoff guy working the count, getting on
base. That helps the middle of the order." In part because of
their patience, the Yankees' games last season averaged 3:05:35,
the longest in the majors (chart, page 79). "If having a long
game means that we're going deep in the count and causing a lot
of pitching changes," says Torre, "well, I'm all for it."
Pitchers tire at different rates, but in his Series appearance
Ashby was nearing a number--75 pitches--at which even many of
the best pitchers tend to lose their effectiveness. In the
American League in '98, teams hit .267 against starters' first
75 pitches, but .293 against the next 15 tosses; in the National
League, the figures were .262 and .282, respectively. Against
Boston Red Sox righthander Pedro Martinez, teams batted .195
through his first 75 pitches; on his next 15 throws, they hit
.276. Likewise, in his starts last season for the Toronto Blue
Jays, Cy Young winner Roger Clemens (now a Yankee) held teams to
an anemic .184 average during his first 75 pitches, but that
figure jumped to .284 in the 15 throws thereafter. Not
surprisingly, Clemens averaged 3.6 more pitches per inning in
his losses than in his wins. "Making a conscious effort to work
the count may only get you a few extra pitches an inning," says
Atlanta Braves pitching coach Leo Mazzone. "But if that means
the starter gets pulled an inning early, that can be a big deal."
Aside from helping a team get to the soft underbelly of an
opponent's pitching staff, extending the count early in the game
often forces a starter to prematurely reveal his repertoire.
Knoblauch admits to being on such a reconnaissance mission in
his momentous at bat against Ashby, whom most of the Yankees
hitters had never seen before. "One of my jobs is to let
everyone on the bench see what the guy is throwing," says
Knoblauch, who finished seventh in the majors in pitches per
plate appearance (4.09) last season (chart at right). "I saw
quite a few of [Ashby's] pitches, and I told everyone what he
had."
From the pitcher's perspective, getting bogged down in a long at
bat is wearing physically and emotionally. "It puts a lot of
pressure on you, especially when it's early in the game, and
you're throwing stuff you were hoping to save for a later
hitter," says a top-tier National League starter. "You're
thinking, My god, it's started already. It's early in the game
and you're already thinking about your pitch count instead of
getting guys out." That this pitcher requested anonymity speaks
volumes about the effectiveness of this technique.
Not that it's as simple as it sounds. Hitters often transgress
the fine line between patience and passivity. At one time
Cleveland Indians manager Mike Hargrove thought Chicago White
Sox first baseman Frank Thomas was getting so concerned about
working the count that he had become a defensive hitter. "He
would pass up chances to drive in runs and help the team," says
Hargrove. Says Thomas, "I know what a strike zone is, and I'll
wait for a pitcher to throw me a strike. If he walks me, that's
fine. I'll take it." Similarly, Philadelphia Phillies third
baseman Scott Rolen wasn't sure what to make of the fact that he
led the National League in most pitches seen (2,899) last
season. "I kind of went, Hmmm, I wonder if that's such a good
thing or not," he says.
Waiting does have its perils. Consider what happens when a team
faces a king of the hill like Braves righthander Greg Maddux.
When Maddux beat the Chicago Cubs 4-1 with a 78-pitch,
complete-game masterpiece two seasons ago, first baseman Mark
Grace had the longest plate appearance of any Cubs batter: five
measly pitches.
Consequently, when Maddux is on his game, hitters tend to
discount the count. "The best pitch you see from him may be the
best pitch to hit," says Arizona Diamondbacks third baseman Matt
Williams. "That first pitch usually is your best shot." Maddux,
for his part, doesn't disagree. "Hey, I have no problem throwing
a lot of pitches," he says with a cheeky smile. "If a guy wants
to go up there and be tentative, take a few and let me get ahead
of the count, it's fine with me."
Moreover, some pitchers--Clemens is one--relish the challenge of
going deep into the count, using the situation to their
psychological advantage. "Sometimes if it's 2 and 2, and the
batter fouls off a few pitches, I'll [deliberately] throw ball
three and make it a full count," Clemens says. "Then the
pressure's on both of us, and I'll feature a different pitch."
Still, plenty of hitters have thrived by practicing
preternatural selection. Rickey Henderson, who joined the New
York Mets in the off-season, may have batted a career-low .236
last season with the Oakland A's, but he led the majors in
pitches per plate appearance (4.33) and in percentage of pitches
taken (67.9), and consequently topped the American League in
walks (118). These statistics, plus his .376 on-base percentage
and 66 stolen bases, helped persuade the Mets to sign the
40-year-old outfielder to be their leadoff man. Yankees
righthander David Cone says that former major leaguer Brett
Butler was the master of taking the count to 3 and 2.
"Sometimes," Cone recalls, "you could swear he was fouling off
pitches on purpose just to annoy the pitcher."
Some hitters qualify for the pitch-count hall of fame on the
basis of a single plate appearance. Facing Cleveland's Bartolo
Colon last June 26, Houston Astros shortstop Ricky Gutierrez had
the longest at bat of the '90s: a 20-pitch, 14-foul showdown
that ended in a strikeout. Briefer but equally intriguing was a
plate appearance two seasons ago by Phillies infielder Kevin
Jordan. Stepping in against the Mets' Jason Isringhausen, Jordan
fell behind in the count 1 and 2, then fouled off 10 straight
pitches. Mets catcher Todd Hundley became so exasperated that at
one point he deferred to home plate umpire Frank Pulli and asked
where to call for the next pitch. Pulli's suggestion: "Right
down the middle, because that's the last thing he's looking
for." On the 14th pitch, though, Isringhausen threw a curve that
bounced in the dirt. The ball eluded Hundley and enabled Rolen
to score the go-ahead run. For good measure, on the next pitch,
a full eight minutes into the at bat, Jordan ripped a two-run
double.
A successful at bat need not be so prolonged. But just as
patience can be a virtue in life, so it can be at the plate.
"Wait for your pitch. Good eye. Make 'em throw strikes." Maybe
there's something to those Little League commandments after
all.
COLOR ILLUSTRATION: ILLUSTRATIONS BY MICHAEL WITTE The waiting game While Knoblauch fiddled at the plate, Ashby burned up energy in the telltale Series at bat.
COLOR ILLUSTRATION: ILLUSTRATIONS BY MICHAEL WITTE Foul play After tipping 10 straight pitches out of play, the disciplined Jordan ripped Isringhausen's 15th offering for a double.
COLOR ILLUSTRATION: ILLUSTRATIONS BY MICHAEL WITTE
COLOR ILLUSTRATION: ILLUSTRATIONS BY MICHAEL WITTE Advantage, Rocket The cocky Clemens can turn the tables and use a deep count as a psychological weapon in his favor.
COLOR ILLUSTRATION: ILLUSTRATIONS BY MICHAEL WITTE He'll pass Though some have wondered if he's overly selective, the discriminating Thomas says he prefers to wait for his pitch.
Is Patience a Virtue at the Plate?
Maybe the forbearance of 40-year-old Rickey Henderson (above),
who played last season with the A's, will rub off on his new
Mets teammate Rey Ordonez. As the numbers below show, the two
were, respectively, the most selective and least selective
hitters in the majors last year among batters with a minimum of
502 plate appearances. Though Ordonez's batting average was 10
points higher than Henderson's, his on-base percentage was
nearly 100 points lower. Then again, hitting early didn't seem
to unduly cripple the knowledgeable Tony Gwynn.
Most Pitches Seen per Plate Appearance in 1998
Pitches
Plate per Plate
Player, Team Appearances Pitches Appearance BA OBP
1. Rickey Henderson, A's 670 2,903 4.33 .236 .376
2. Ray Lankford, Cardinals 626 2,651 4.23 .293 .391
3. Jay Bell, Diamondbacks 645 2,677 4.15 .251 .353
4. Carlos Delgado, Blue Jays 620 2,569 4.14 .292 .385
5. Edgardo Alfonzo, Mets 630 2,594 4.12 .278 .355
Jim Thome, Indians 537 2,211 4.12 .293 .413
7. Chuck Knoblauch, Yankees 706 2,886 4.09 .265 .361
8. Edgar Martinez, Mariners 672 2,745 4.08 .322 .429
Mark McLemore, Rangers 567 2,316 4.08 .247 .369
Rusty Greer, Rangers 691 2,820 4.08 .306 .386
Fewest Pitches Seen per Plate Appearance in 1998
1. Rey Ordonez, Mets 548 1,664 3.04 .246 .278
2. Vinny Castilla, Rockies 697 2,146 3.08 .319 .362
3. Mike Caruso, White Sox 555 1,715 3.09 .306 .331
4. Gary DiSarcina, Angels 595 1,853 3.11 .287 .321
5. Vladimir Guerrero, Expos 677 2,134 3.15 .324 .371
6. Fernando Vina, Brewers 722 2,290 3.17 .311 .386
7. Carlos Baerga, Mets 551 1,761 3.20 .266 .303
8. Tony Gwynn, Padres 505 1,629 3.23 .321 .364
9. Magglio Ordonez, White Sox 578 1,899 3.29 .282 .326
Mark Kotsay, Marlins 623 2,047 3.29 .279 .318
OBP: On-base percentage SOURCE: Stats Inc.
A Knock On Wood?
Regularly going deep into the count may not bother many of the
top established pitchers, but it might have hurt Kerry Wood.
Firing away, the Cubs' rookie righthander struck out 233 batters
in 166 2/3 innings last year, but, as the chart at right
reveals, in doing so he threw more pitches per batter than
anyone else in the majors with 20 or more starts. On March 16,
Wood was shut down for '99 (and maybe longer) with a torn ulnar
collateral ligament in his right elbow. Coincidence? At the
other end of the spectrum, the starter who threw the fewest
pitches per batter was veteran righthander Mark Portugal, who
was with the Phillies last year and will be in the Red Sox
rotation in '99. The control pitcher worked just one third of an
inning less than Wood but threw 524 fewer pitches.
Efficiency Experts...
Batters Total Pitches/ Opp. Opp.
Pitcher, Team Faced Pitches Batter BA OBP W-L ERA
1. Mark Portugal,
Phillies 704 2,314 3.29 .283 .319 10-5 4.44
2. Brian Meadows,
Marlins 772 2,545 3.30 .315 .358 11-13 5.21
3. Sean Bergman,
Astros 718 2,380 3.31 .268 .315 12-9 3.72
Bob Tewksbury,
Twins 630 2,086 3.31 .292 .318 7-13 4.79
5. Greg Maddux,
Braves 987 3,291 3.33 .220 .260 18-9 2.22
6. Brian Anderson,
Diamondbacks 845 2,819 3.34 .274 .297 12-13 4.33
7. Andy Ashby,
Padres 939 3,145 3.35 .259 .309 17-9 3.34
8. Carlos Perez,
Expos-Dodgers 1,009 3,453 3.42 .264 .312 11-14 3.59
9. Tim Wakefield,
Red Sox 912 3,128 3.43 .252 .324 17-8 4.58
10. Mike Morgan,
Cubs 514 1,773 3.45 .293 .355 4-3 4.18
...Deep Counters
Batters Total Pitches/ Opp. Opp.
Pitcher, Team Faced Pitches Batter BA OBP W-L ERA
1. Kerry Wood,
Cubs 699 2,838 4.06 .196 .306 13-6 3.40
2. Al Leiter,
Mets 789 3,198 4.05 .216 .298 17-6 2.47
3. Randy Johnson,
Mariners-Astros 1,014 4,064 4.01 .224 .300 19-11 3.28
4. Steve Sparks,
Angels 532 2,126 4.00 .263 .345 9-4 4.34
5. Wilson Alvarez,
Devil Rays 624 2,481 3.98 .239 .332 6-14 4.73
Tony Saunders,
Devil Rays 855 3,406 3.98 .265 .364 6-15 4.12
7. Orlando Hernandez,
Yankees 574 2,281 3.97 .222 .299 12-4 3.13
8. Matt Beech,
Phillies 531 2,101 3.96 .275 .366 3-9 5.15
Roger Clemens,
Blue Jays 961 3,806 3.96 .198 .277 20-6 2.65
Pedro Martinez,
Red Sox 951 3,766 3.96 .217 .278 19-7 2.89
Blake Stein,
Athletics 496 1,963 3.96 .255 .359 5-9 6.37
Woody Williams,
Blue Jays 894 3,541 3.96 .245 .314 10-9 4.46
OBP: On-base percentage SOURCE: Stats Inc.
Damn Slow Yankees
The Yankees' assiduousness at working the count may pay off in
two areas: at the plate and at the concession stand. No doubt
affected by the many pitches the finicky New York batters saw
(as well, of course, as by their 965 runs scored, the most in
the majors), Yankees games, on average, were easily the longest
in either league in 1998, as the chart below shows. Don't blame
the Yankees' pitchers, either: The New York staff was the most
economical in the American League. (League rankings in
parentheses.)
American League
Pitches Total
Pitches Thrown/ Pitches/ Avg. Game
Team Faced/Game Game Game Time
1. Yankees 152.6 141.3 (1) 293.8 (5) 3:05:35 (1)
2. Athletics 151.7 143.9 (5) 295.6 (2) 2:56:07 (7)
3. Indians 150.7 147.8 (10) 298.5 (1) 2:58:43 (3)
4. Rangers 149.4 142.8 (3) 292.2 (8) 2:55:35 (9)
5. Mariners 148.4 145.4 (7) 293.9 (4) 2:54:40 (10)
6. Red Sox 145.9 141.9 (2) 287.9 (13) 2:52:55 (11)
7. Blue Jays 145.7 149.6 (13) 295.3 (3) 2:57:06 (6)
8. Orioles 145.3 143.5 (4) 288.8 (12) 3:01:33 (2)
9. Royals 143.6 148.9 (12) 292.6 (7) 2:50:04 (14)
10. Devil Rays 143.0 148.0 (11) 291.1 (9) 2:56:04 (8)
11. White Sox 142.8 147.6 (9) 290.4 (10) 2:52:29 (12)
12. Tigers 142.6 147.1 (8) 289.7 (11) 2:51:14 (13)
13. Angels 142.5 150.3 (14) 292.8 (6) 2:58:10 (4)
14. Twins 140.2 144.7 (6) 284.9 (14) 2:57:50 (5)
National League
1. Giants 147.3 145.1 (14) 292.4 (2) 2:56:15 (1)
2. Cubs 147.1 148.8 (16) 295.9 (1) 2:54:30 (3)
3. Cardinals 146.4 143.2 (10) 289.6 (4) 2:53:34 (5)
4. Astros 145.6 139.9 (6) 285.5 (8) 2:53:50 (4)
5. Phillies 144.9 144.6 (13) 289.5 (5) 2:48:53 (8)
6. Reds 143.8 142.1 (9) 285.9 (7) 2:45:43 (11)
7. Mets 143.1 143.4 (11) 286.6 (6) 2:55:56 (2)
8. Marlins 141.7 148.6 (15) 290.3 (3) 2:51:14 (6)
9. Brewers 141.1 144.2 (12) 285.3 (9) 2:51:09 (7)
10. Padres 140.9 139.2 (5) 280.1 (10) 2:43:46 (12)
11. Braves 139.7 137.1 (1) 276.8 (13) 2:41:48 (14)
12. Diamondbacks 138.6 137.8 (2) 276.5 (14) 2:42:45 (13)
13. Rockies 137.1 141.1 (8) 278.2 (11) 2:46:22 (9)
14. Dodgers 136.7 140.9 (7) 277.6 (12) 2:45:46 (10)
15. Pirates 136.3 138.8 (3) 275.1 (15) 2:40:59 (16)
16. Expos 130.8 139.1 (4) 269.9 (16) 2:41:35 (15)
SOURCE: Stats Inc.